

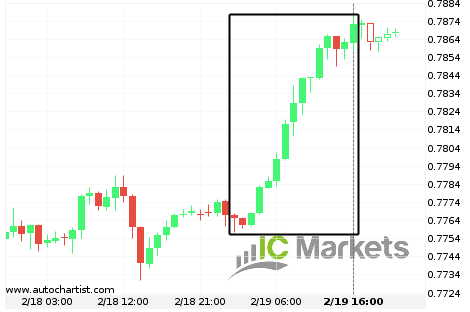
Huge bullish move on AUDUSD
AUDUSD has moved higher by 1.38% from 0.777 to 0.787 in the last 15 hours.

Irrupción inminente de el soporte por el FTSE China A50 Index
El FTSE China A50 Index avanza hacia la línea de soporte de un Cuña descendente, que ya ha probado varias veces en el pasado. Hemos visto un retroceso antes desde esta línea, así que en esta etapa no está claro si atravesará esta línea o se recuperará como lo ha hecho anteriormente. Si el FTSE […]
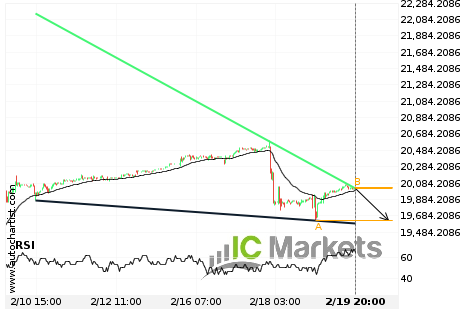
Breach of support line imminent by FTSE China A50 Index
FTSE China A50 Index is moving towards the support line of a Falling Wedge which it has tested numerous times in the past. We have seen it retrace from this line before, so at this stage it isn’t clear whether it will breach this line or rebound as it did before. If FTSE China A50 […]

FTSE China A50 Index Nível visado: 19624.0700
Cunha descendente identificado em 19-fev-2021 20:00 UTC. Este padrão está ainda em processo de formação. Possível previsão de movimento em baixa para o nível de 19624.0700 no próximo 2 dias.
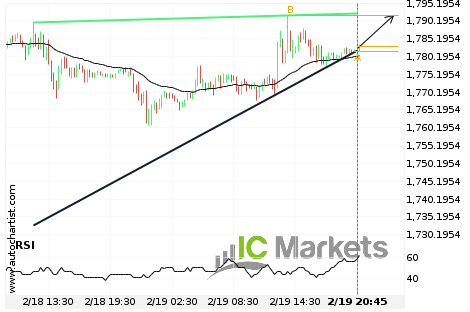
Irrupción inminente de la resistencia por el GOLD
El GOLD avanza hacia la línea de resistencia de un Cuña ascendente, que ya ha probado varias veces en el pasado. Hemos visto un retroceso antes desde esta línea, así que en esta etapa no está claro si atravesará esta línea o se recuperará como lo ha hecho anteriormente. Si el GOLD continúa con esta […]
การเคลื่อนตัวแบบ bullish ขนาดใหญ่ของ AUDUSD
AUDUSD ได้เคลื่อนตัวสูงขึ้น 1.38% จาก 0.777 ไปยัง 0.787 ในช่วง 15 ชั่วโมง ที่ผ่านมา

GOLD Nível visado: 1791.6900
Cunha ascendente identificado em 19-fev-2021 20:45 UTC. Este padrão está ainda em processo de formação. Possível previsão de movimento em alta para o nível de 1791.6900 no próximo 10 horas.
GOLD กำลังเข้าใกล้แนวต้านของ จั่วแบบลง
GOLD กำลังเข้าใกล้เส้นแนวต้านของ จั่วแบบลง ราคาได้มาแตะเส้นนี้หลายครั้งแล้วในช่วง 3 วัน ถ้าหากราคาจะมาแตะที่เส้นนี้อีกครั้ง ราคาควรจะมาแตะในอีก 15 ชั่วโมง

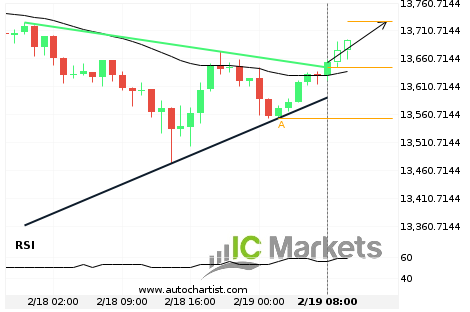
Should we expect a bullish trend on US Tech 100 Index?
The breakout of US Tech 100 Index through the resistance line of a Triangle could be a sign of the road ahead. If this breakout persists, we expect the price of US Tech 100 Index to test 13727.2517 within the next 7 hours. One should always be cautious before placing a trade, wait for confirmation […]
เราค่าว่าจะได้เห็นแนวโน้ม bullish สำหรับ US Tech 100 Index หรือไม่?
การเบรคของ US Tech 100 Index ผ่านเส้นแนวต้านของ สามเหลี่ยม อาจเป็นสัญญาณของเส้นทางด้านหน้า ถ้าหากการเบรคนี้ยังคงยืนอยู่ได้ เราคาดว่าจะเห็นราคาของ US Tech 100 Index ไปทดสอบที่ 13727.2517 ภายในช่วง 7 ชั่วโมงถัดไป เทรดเดอร์ควรระมัดระวังก่อนทำการเทรด รอการยืนยันของการเบรคก่อนใส่เงินลงไป